


Graph IDE
Developer: VVIMAGING, INC.
249 USD
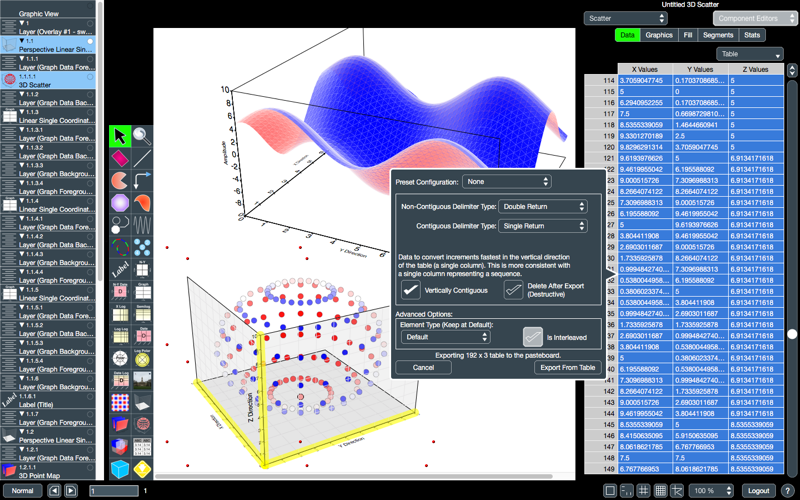
Data visualization and analysis has converged at the nexus of features, reliability and speed with Graph IDE™. Each generation of Graph IDE is designed first by specifying bodacious features well beyond the ability to implement in a single step. Those feature sets are acquired from major corporations within financial, business, scientific, engineering and other technical-oriented industries. Then a generation is tuned for reliability and speed. Many generations have completed which has resulted in the current Graph IDE. Implemented on the Mac, iPad and in web browsers it gives unparalleled access to features. Using the most direct platform API accounts for its amazing speed. The SVG serializer is custom made for web browsers and also for exporting to industry standard formats with unique features such as named colors. Even the textual number formatter is twice as fast as system functions. Typically, a data analysis application starts with a single spreadsheet for data entry but Graph IDE goes far beyond that. Graphs and other data visualizations can exist without spreadsheets and, as you see fit, spreadsheets can be dragged and dropped onto a document for unlimited combinations of visuals and spreadsheets. A document implements both single-page tiling and multiple-pages so that one document can contain your entire data visualization portfolio. Pages in a document can be named and scrubbed. Pagination can serialize tiles and pages into one convenient PDF document as needed.
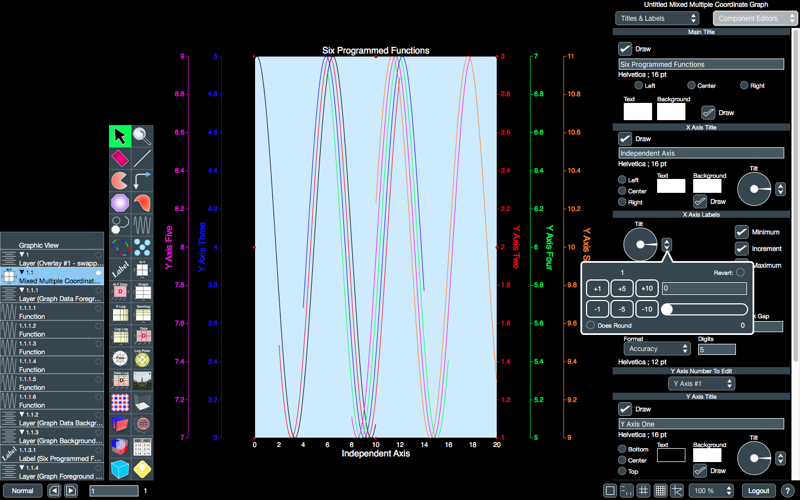
With its selection of 2D and 3D graphs, spreadsheets and many specialized visuals, such as strip charts, it is rich in choices. With its specialized user interface tailored to data visualization it handles the myriad of attributes unique to data visualization. For example, markers are general graphics and can be selected from a template or created from scratch. This unique capability gives rise to the recursive user interface. Many controls depart from typical implementations such as floating ticks where ticks can be placed differently from the graph frame. Throughout Graph IDE, units are specified in controls and settable in graphs. Numeric and textual data entry includes both formatters and validators to ensure integrity.
The above description sounds both fantastic and overwhelming at first. To ease your introduction, Graph IDE implements importing of standard CSV and tab-delimited files which can be directly opened by Graph IDE and also imported into a Graph IDE documents spreadsheet. Essentially click to make a spreadsheet document while additional point-and-clicks associate that spreadsheet with a visual. At first, this is a good way to form documents and when you desire more then you can advance to more powerful ways to construct visuals as you see fit. Once that advancement is made then you realize how anachronistic prior ways of doing things are.
Graph IDE stands on its own as a robust application. It also implements corporate workgroup features such as retrieving and coordinating documents from a cloud service, either on the Internet or collocated at a corporate site within a secure LAN. It includes a custom-made JIT compiler for efficient animation and also formula generation in spreadsheets. On the Mac, a bundle resource can be loaded to facilitate automated data importing. The Graph IDE Xcode project is also available for customization.
Use Graph IDE as a standalone retail product or as a beginning to improving your corporate workflows. Contact VVI at [email protected] with your questions and for additional help and product details.